on
Final Prediction
Welcome to my 2022 Midterm blog series. I’m Kaela Ellis, a junior at Harvard College studying Government. This semester I am taking Gov 1347: Election Analytics taught by Professor Ryan Enos, which has led to the creation of this blog. The goal of this blog series is to predict the 2022 Midterm election. I have updated my model with new variables each week. This has led me to a final prediction, which I will detail in this post.
##Model Formula After testing many different models, I decided to use four variables in predicting the election: presidential approval rating, consumer sentiment, generic ballot, and incumbency. I predicted the incumbent party vote share, based on how the incumbent party vote share for midterm years 1954 through 2018 interacted with those four variables. Here is an outline of how I calculated my variables:
Presidential Approval Rating: Using Gallup, I took the incumbent party’s presidential approval rating for the October before the midterm election. For example, I determined the 2018 approval rating by taking Trump’s approval rating from October, which was 43%.
Consumer Sentiment: Using the University of Michigan’s consumer sentiment data, I took the consumer sentiment for the October before the midterm election.
Generic Ballot: Using the generic ballot data provided in class, I took the polls of the incumbent party as a percentage. So, when Republicans were the incumbent in 1954, I entered the expressed support for the Republican party as a percentage. Then when Democrats were the incumbent in 1962, I entered the expressed support for the Democratic party as a percentage. I filtered for polls that occurred 52 days before the election.
Incumbency: Using the house incumbency data provided in class, I took the sum of incumbent house candidates the president’s incumbent party had each midterm election. With these variables I made the following equation for predicting the election:
IncumbentVoteShare = β0 + β1ApprovalRating + β3ConsumerSentiment + β5GenericBallot + β6Incumbency
##Justification
Rather than arbitrarily choosing to predict the Dem vote share or the Rep vote share, my model predicts the Dem vote share because they are the incumbent party. The decision to base my model on how the fundamentals affect the incumbent party vote share was largely informed by retrospective voting theory. In “Democracy for Realists”, Achen and Bartels explain how voters use elections to hold incumbents accountable. Under the sanctioning model, voter welfare depends on the effort expended by the incumbent. So, if voters’ welfare decreases, voters punish the incumbent party by not reelecting them. Fundamentals can be used to assess changes in voter welfare. Thus, I based my model on how fundamentals, such as consumer sentiment, relate to the incumbent party. I also chose to only look at midterm elections because the factors that affect the vote outcome in midterm years are different and weighted differently than in election years.
I decided to incorporate the presidential approval rating into my model per the advice of guest speakers, particularly Lynn Vavreck. Incorporating presidential approval ratings into my model also supports my retrospective voting approach. If presidents have a higher presidential approval rating, their party will be rewarded in the house.
I chose consumer sentiment as my economic variable because consumer sentiment is how consumers view the economy. It is based on five questions: three ask for people’s measure of their current financial circumstances, and two measure their expectations for the future. Therefore, it factors in all different types of economic indicators, as consumers naturally factor in things like GDP, RDI, and unemployment into their outlook of the economy. Since consumer sentiment is a measure of how voters view the economy, it should correlate more directly with the vote share than other economic indicators. In Lynn Vavreck’s “The Electoral Landscape of 2016”, she explains how consumer sentiment is a good indicator for predicting elections.
I incorporated generic ballot polls because they reflect voters’ support for each party, and thus indicate who they are likely to vote for. I decided to incorporate the most recent polls, which were those up 52 days out because recent current support for each party is more likely to predict the election.
My last variable was an incumbency variable. In “Incumbency Advantage in US Presidential Elections: the historical record”, David Mayhew explains why individual candidates experience the incumbency advantage – that is individual incumbents are more likely to be reelected. While I was not doing a district-level prediction, I still wanted to incorporate this incumbency advantage. So, I calculated how the number of incumbent candidates running in each midterm election correlated with the national vote share of that party. Since incumbents are more likely to be reelected, this allowed me to incorporate the incumbency advantage that individual candidates experience.
##
## Results
## ========================================================================================================================================
##                                                                     Dependent variable:
##                     --------------------------------------------------------------------------------------------------------------------
##                                                                          Vote_Share
##                          ApprovalRating       ConsumerSentiment       GenericBallot            Incumbency                 All
##                               (1)                    (2)                   (3)                    (4)                     (5)
## ----------------------------------------------------------------------------------------------------------------------------------------
## Approval Rating             0.152***                                                                                    0.240***
##                             (0.008)                                                                                     (0.008)
##
## Consumer Sentiment                                 -0.010                                                               0.041***
##                                                    (0.012)                                                              (0.006)
##
## Generic Ballot                                                          -8.499***                                       5.376***
##                                                                          (2.517)                                        (1.448)
##
## Incumbency                                                                                      0.091***                0.085***
##                                                                                                 (0.023)                 (0.004)
##
## Constant                   40.025***              48.418***             52.037***              30.702***               12.105***
##                             (0.427)                (1.005)               (1.336)                (4.387)                 (1.679)
##
## ----------------------------------------------------------------------------------------------------------------------------------------
## Observations                  420                    420                   420                     18                     420
## R2                           0.440                  0.002                 0.027                  0.497                   0.716
## Adjusted R2                  0.439                 -0.001                 0.024                  0.466                   0.714
## Residual Std. Error     2.042 (df = 418)      2.727 (df = 418)      2.693 (df = 418)        2.638 (df = 16)         1.459 (df = 415)
## F Statistic         328.980*** (df = 1; 418) 0.763 (df = 1; 418) 11.405*** (df = 1; 418) 15.817*** (df = 1; 16) 262.175*** (df = 4; 415)
## ========================================================================================================================================
## Note:                                                                                                        *p<0.1; **p<0.05; ***p<0.01
##Regression Analysis The adjusted R2 of my model which includes all of my variables is 0.714, which indicates that my model is relatively strong. When looking at the individual coefficients of the variables in my model many of them seem counterintuitive. For example, when I take a regression of only the consumer sentiment, for every point consumer sentiment increases, the incumbent party vote share decreases by 0.010 points. However, when consumer sentiment is added to the entire model this coefficient changes – for every point consumer sentiment increases, the incumbent party vote share increases by 0.041. A similar trend is seen in the generic ballot – for every percentage point increase in the generic ballot that the incumbent party receives, their vote share decreases by 8.499 points. However, when the generic ballot is incorporated into my comprehensive model, for every point the generic ballot increases, the vote share increase by 5.376. These oddities should place scrutiny on my model. Although a variable has an intuitive relationship in the comprehensive model, it is important to look at its individual relationship with the dependent variable. Because these desired relationship does not hold when that variable is examined individually my model is questionable.
The presidential approval rating and incumbency variables have the desired relationship when the coefficients from the individual model and comprehensive model are examined. For presidential approval rating: for every percentage point increase in presidential approval rating, the incumbent vote share increases by 0.152. This relationship is mirrored in the comprehensive model, as for each percentage point increase in presidential approval rating, the incumbent vote share increases by 0.240. For the incumbency variable: for each additional incumbent candidate, the incumbent vote share increases by 0.091. This relationship is mirrored in the comprehensive model, as for each additional incumbent candidate, the vote share increases by 0.085.
## [1] 45.58466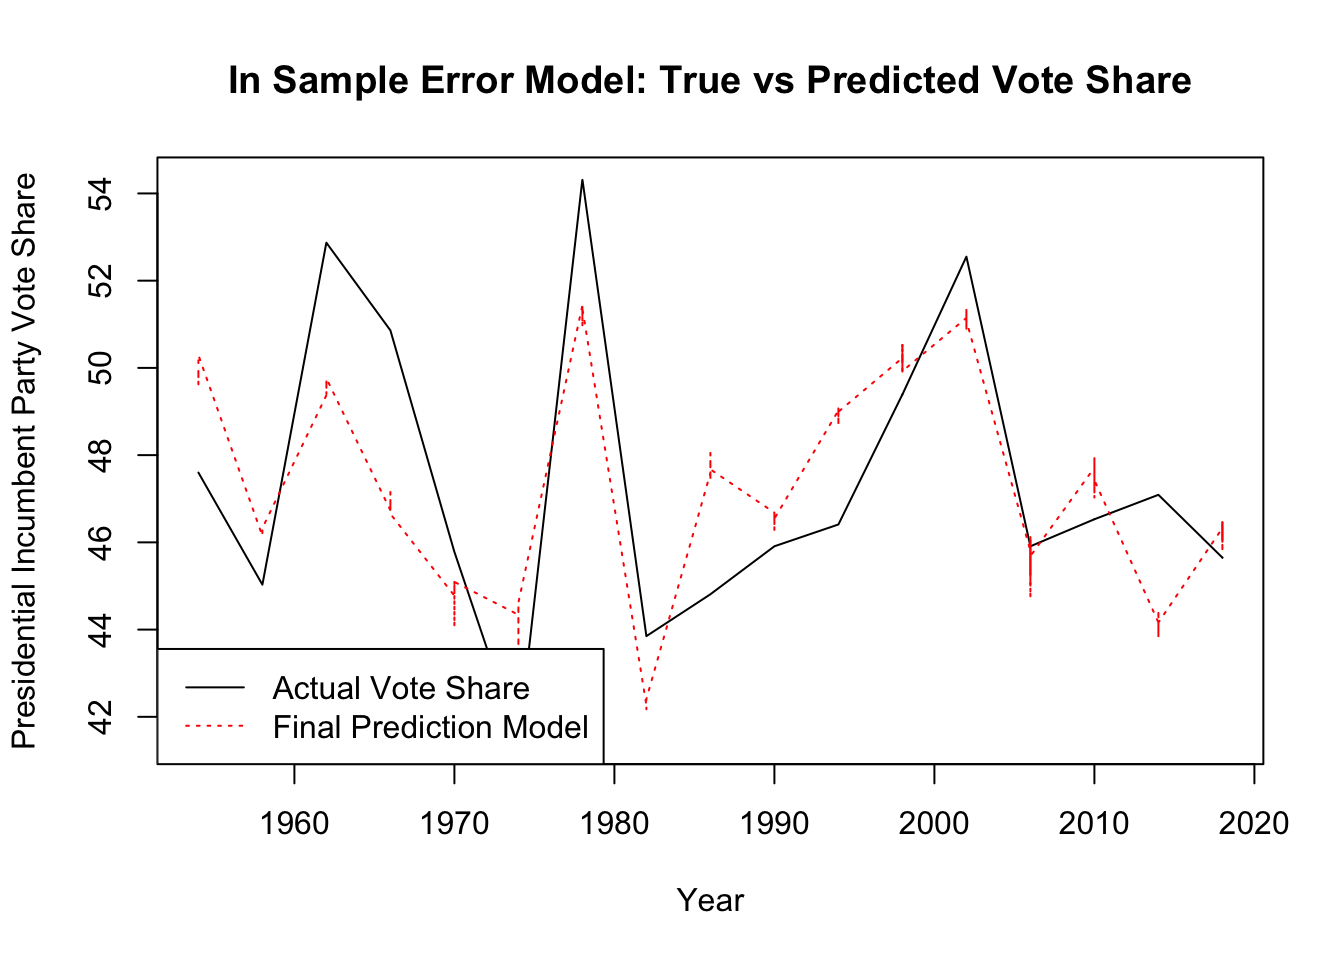
## [1] -0.4395705##Model Validation
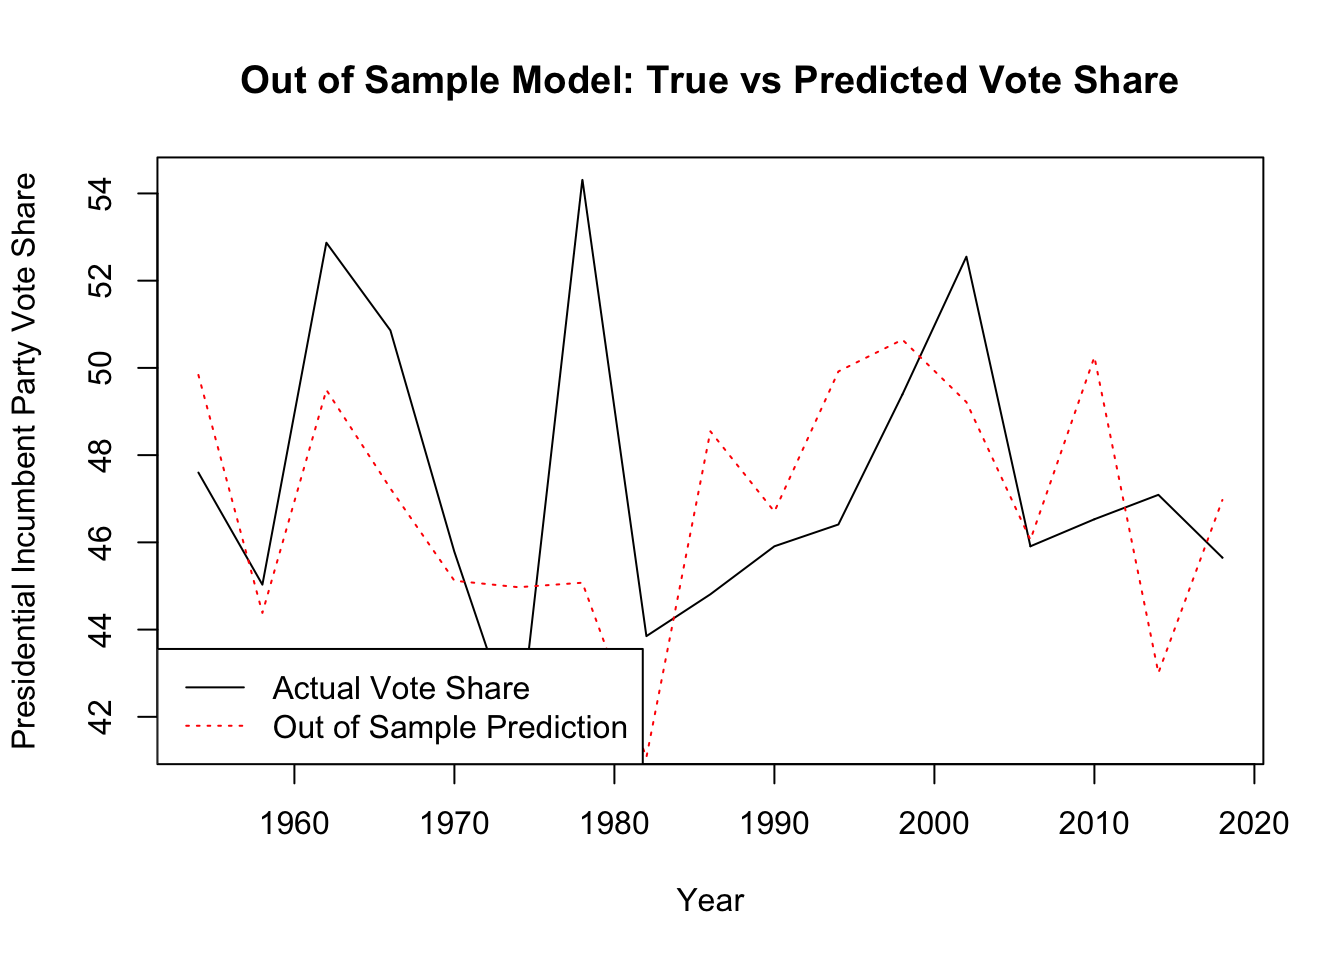
I graphed both the in-sample error and the out-of-sample error. I calculated my out-of-sample for each year by removing that year from the dataset and then predicting the election for that year. My in-sample error is much better than my out-of-sample error. My out-of-sample error reflects some underlying issues with my model, which leads me to question the accuracy of my final prediction.
## [1] 56.07725## Model Fit lwr upr
## 1 Dem Prediction 45.67219 42.77461 48.56978
## 2 Rep Prediction 55.97371 53.06932 58.87810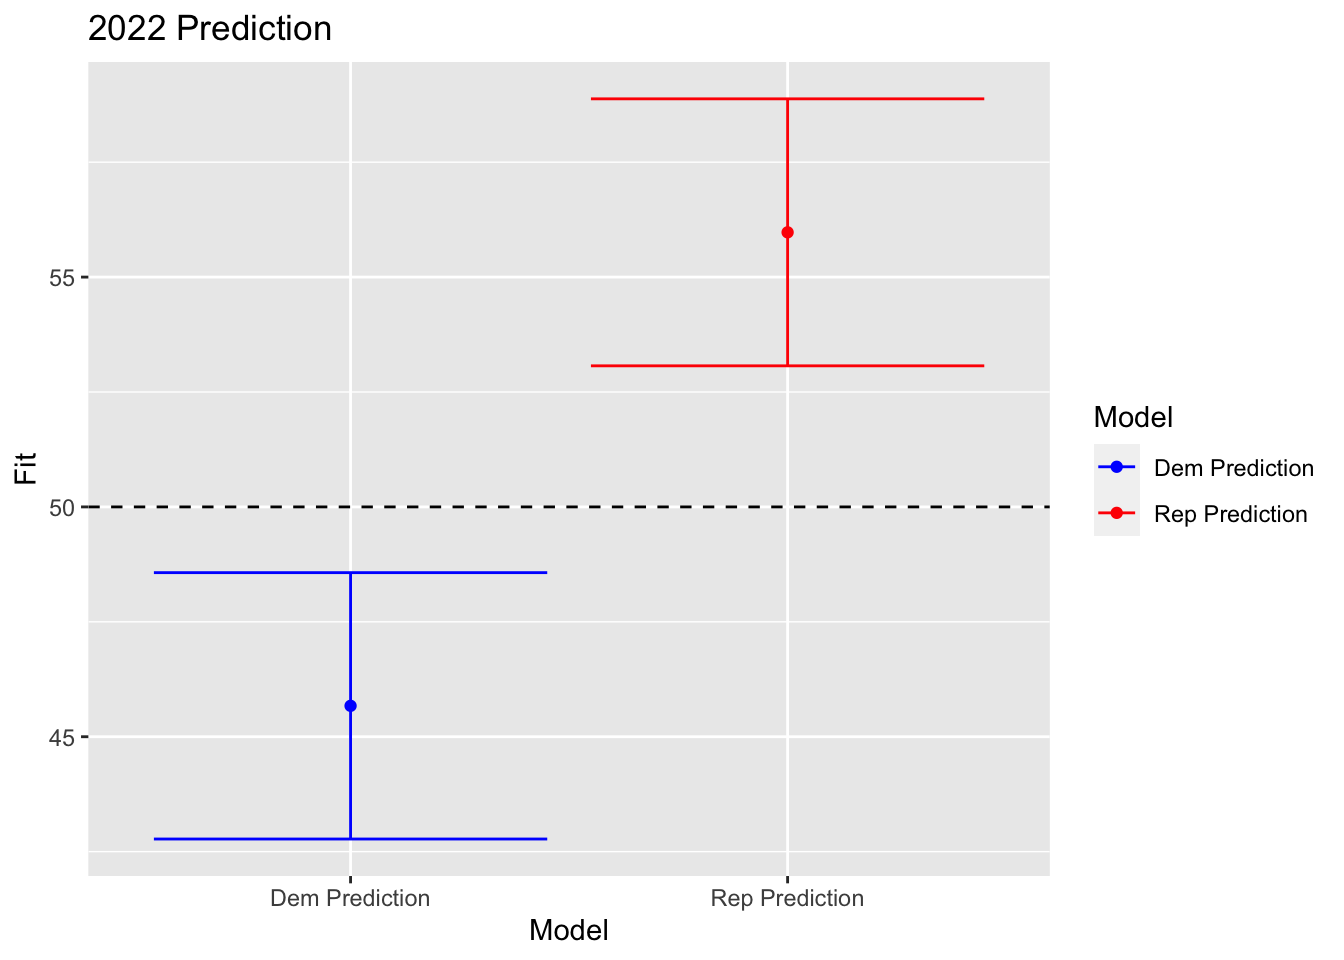 ##Prediction
The following is a graph of my predicted election results. I predict that the Democrats will win 45.58466% of the vote share. The upper and lower bounds of the Democrats and Republicans do not overlap. Therefore, my model is certain in its prediction that the Republicans will obtain the majority of the vote share. However, my model is certainly not perfect, and I look forward to seeing how my prediction compares to the actual results.