on
Blog Post 5
Welcome to my 2022 Midterm blog series. I’m Kaela Ellis, a junior at Harvard College studying Government. This semester I am taking Gov 1347: Election Analytics taught by Professor Ryan Enos, which has led to the creation of this blog. I will use this blog series to predict the 2022 Midterm election. The series will be updated weekly with new predictive measures and analyses of past elections.
In this week’s blog post I will be examining the effectiveness of ads, and how ads can be used to predict elections. I will first examine some relevant literature on the effect of ads. According to literature, such as Lynn Vavreck’s “The Message Matters” and Gerber et al.’s “How Large and Long Lasting are the Persuasive Effects of Televised Campaign Ads?”, television ads appear to have a rapid decay effect. Gerber et al. explain how, for house elections, two to three days after the ad has aired its effect has almost completely disappeared. However, there is evidence from these papers that ads change the weight that voters attach to certain issues. Therefore, the content of ads do matter.
In Lynn Vavreck’s “The Message Matters”, she explains candidates should make ads that play into their role as either an insurgent or clarifying candidate. A clarifying candidate is candidate that is the candidate that the economy benefits – the Republican party in this election. She argues that these candidates should focus on the economy in their advertisements, and if they fail to do so they’re victory rate decreases to ⅖. Meanwhile the insurgent candidate is the candidate that the economy does not benefit – the Democratic party. According to Vavreck, the insurgent candidate should use ads to refocus the election off the economy; they should ideally focus on an issue that they have previously taken and that they are closer to most voters on. Insurgents are at a disadvantage, but they can win elections by priming the correct issues. For example, JFK won as an insurgent candidate against Nixon by focusing on the war agaisnt communism. The Democratic party has done this for the 2022 midterm by focusing on other issues such as Abortion rights. The limit in my analysis for this week is that I do not have advertising data for 2022, so I can not determine which issues each party has ran the most ads on.
## Warning in sprintf("https://cdmaps.polisci.ucla.edu/shp/districts114.zip", :
## one argument not used by format 'https://cdmaps.polisci.ucla.edu/shp/
## districts114.zip'
## Warning in sprintf("districtShapes/districts114.shp", cong): one argument not
## used by format 'districtShapes/districts114.shp'## Reading layer `districts114' from data source
## `/private/var/folders/53/y4tjcyz17pq_kfwb17bygwvm0000gp/T/RtmpQTJDxP/districtShapes/districts114.shp'
## using driver `ESRI Shapefile'
## Simple feature collection with 436 features and 15 fields (with 1 geometry empty)
## Geometry type: MULTIPOLYGON
## Dimension: XY
## Bounding box: xmin: -179.1473 ymin: 18.91383 xmax: 179.7785 ymax: 71.35256
## Geodetic CRS: NAD83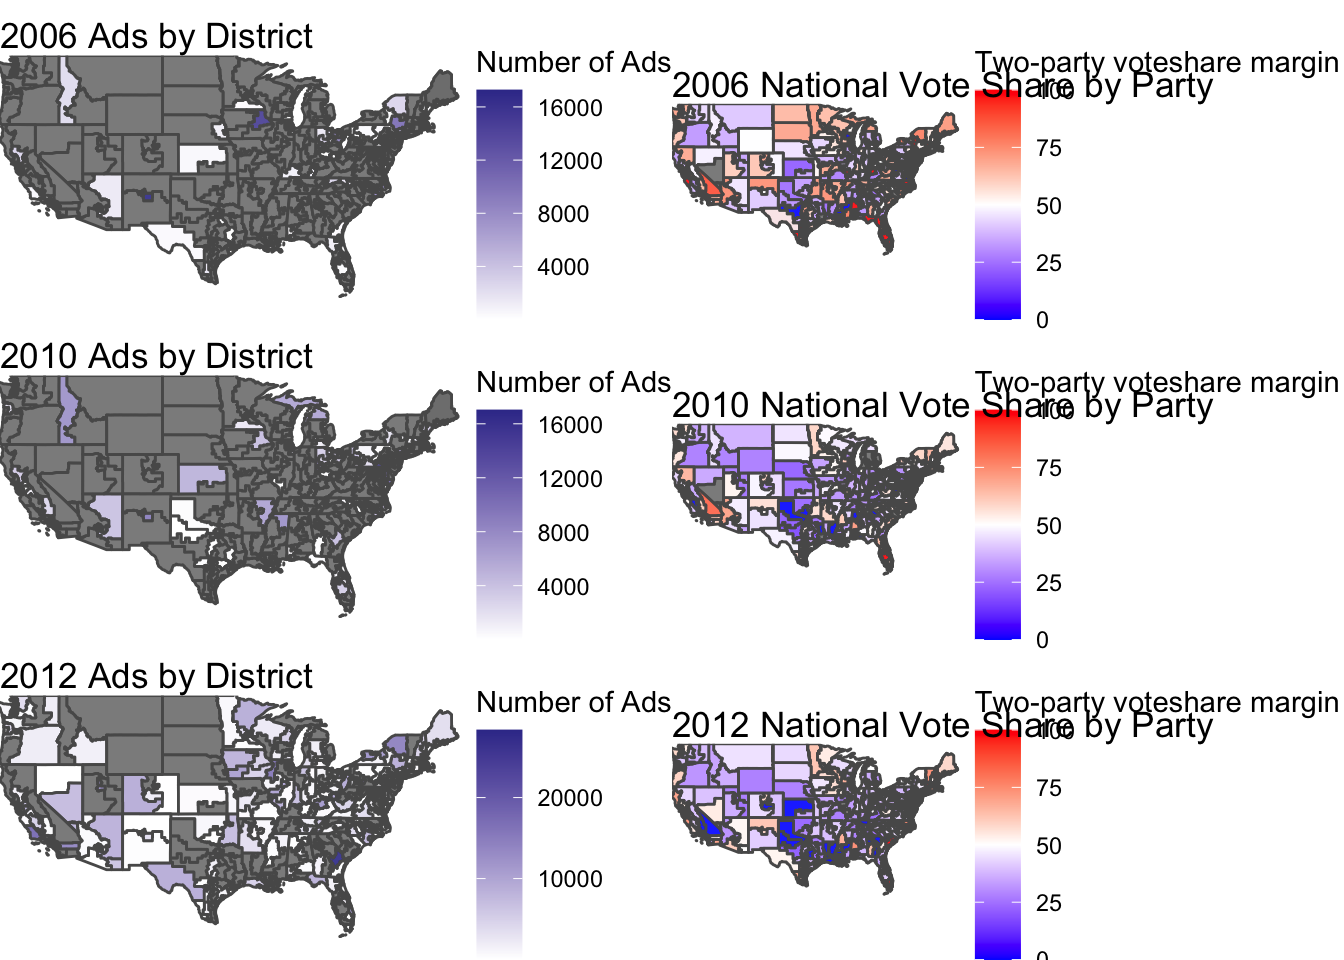
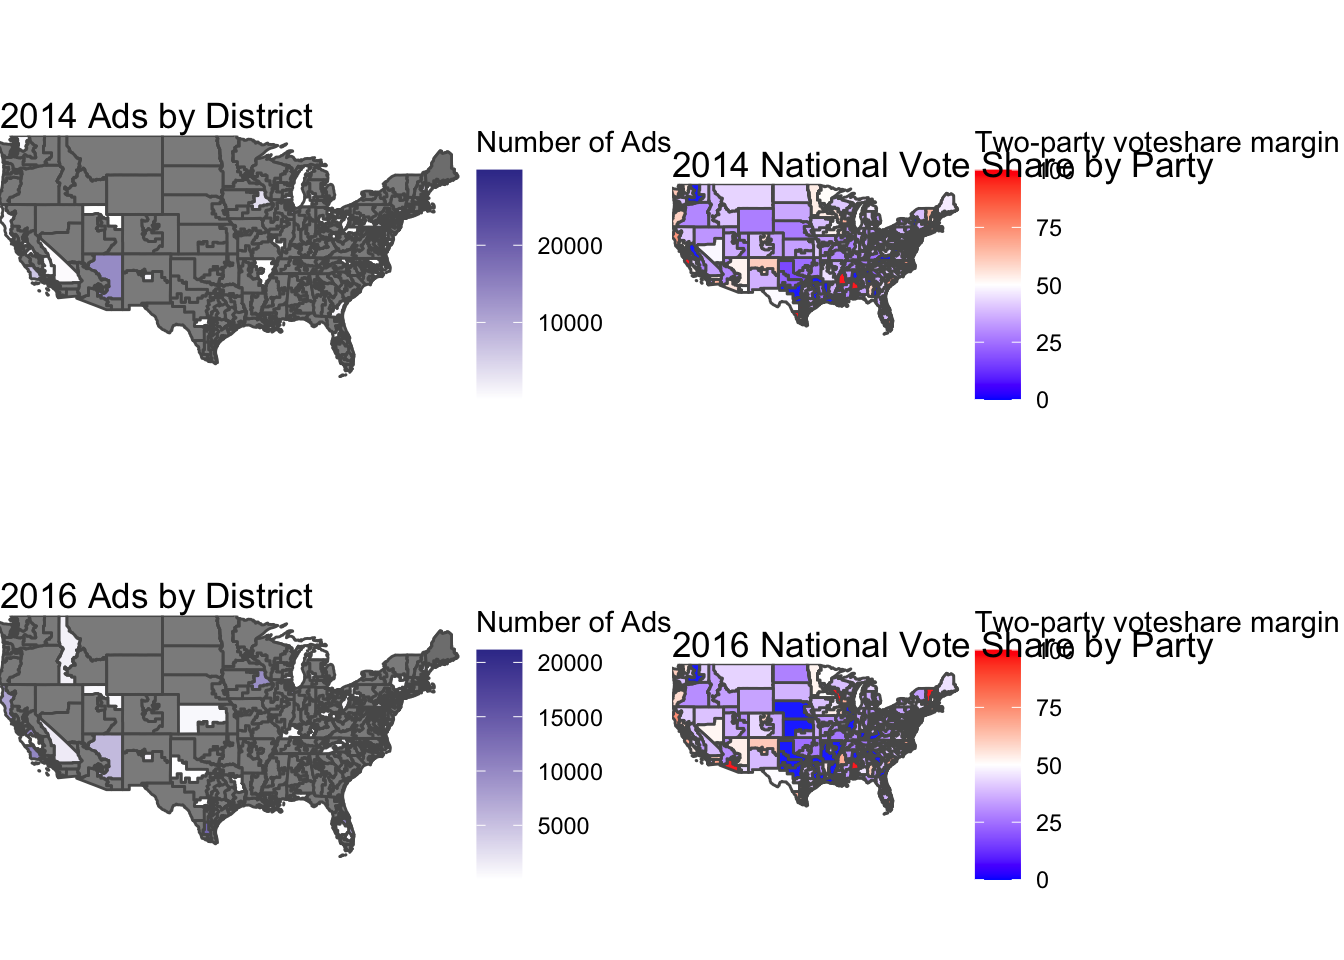 The above graphs compare the number ads in each district to the voteshare. By comparing the years, I can examine if states with higher ads leads to a flip in that district from cycle to cycle. In 2010, Arkansas’ 1st district had high ads and flipped. In 2012, some districts with high ads that flipped: Minnesota’s 8th, New York’s 21st, Texas’ 23rd, and others. In 2014, Arizona’s 1st had high ads and flipped. There are many clear limitations to this. First being, I do not have ad data on most districts. Therefore, I can only see the effects of ads on a very small scale. Additionally, academic literature, particularly focusing on that of Gerber et al., highlights how especially in midterm elections the effects of ads have such a short lifetime. Gerber et al. found that ads during midterm elections have a lifetime of two to three days. Being this, in addition to the limited ad data, including ads in my final prediction would not be wise.
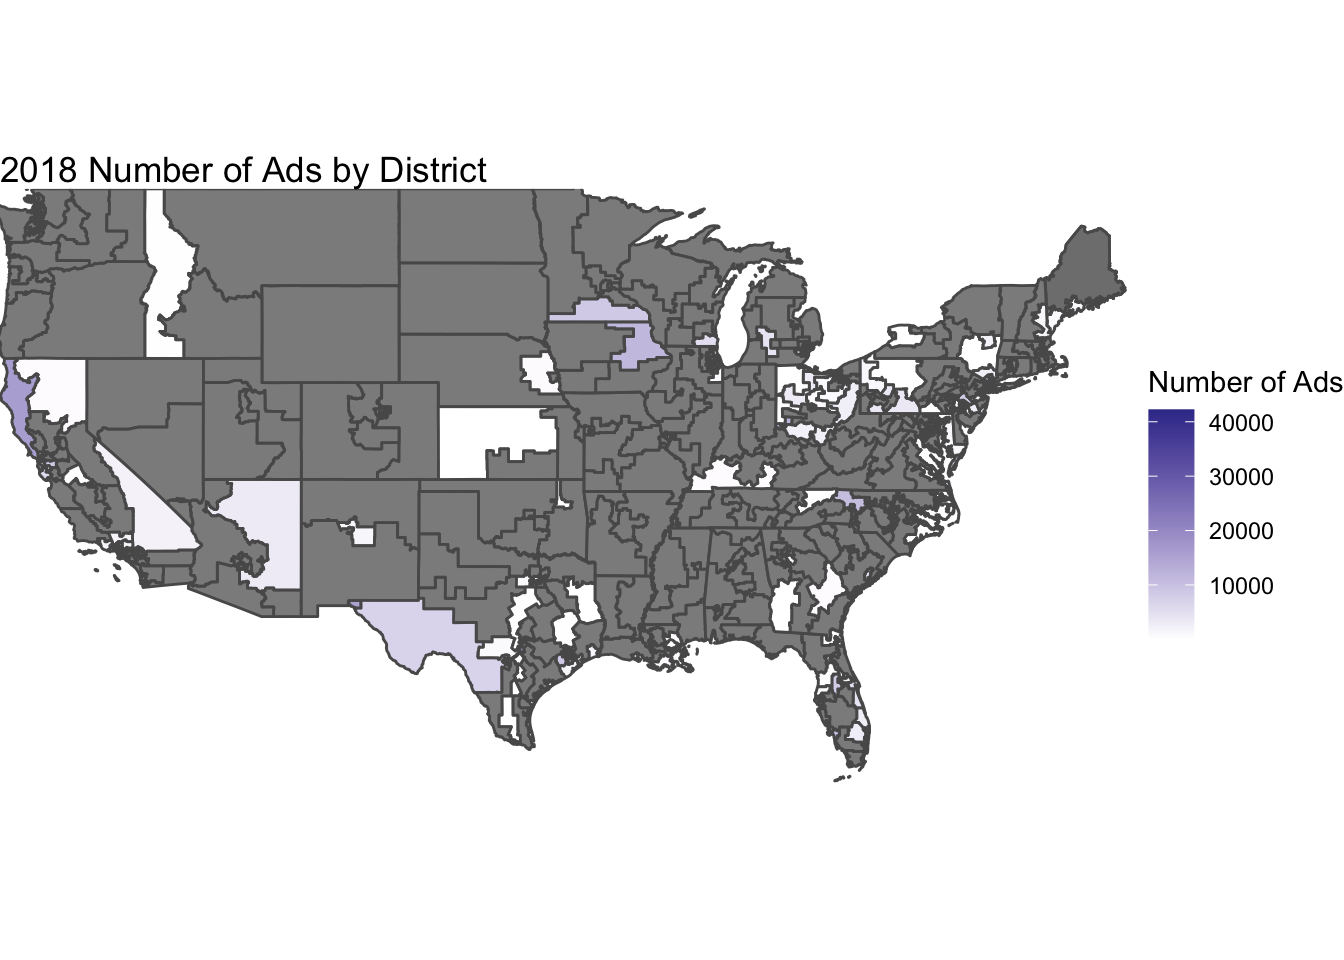
 The above graph shows the number of ads aired in each district and the actual voteshare of that district. When comparing this to the 2016 voteshare, the districts that I have ad data on did not flip. Ads could have been used to keep that district in the given party, but the effect of ads is unclear, and literature is weak in supporting that ads make a significant difference in elections. Since the data is so limited I will not be using ad data in my final predictions, and my prediction remains that Republicans will receive 51.39% of the vote share.
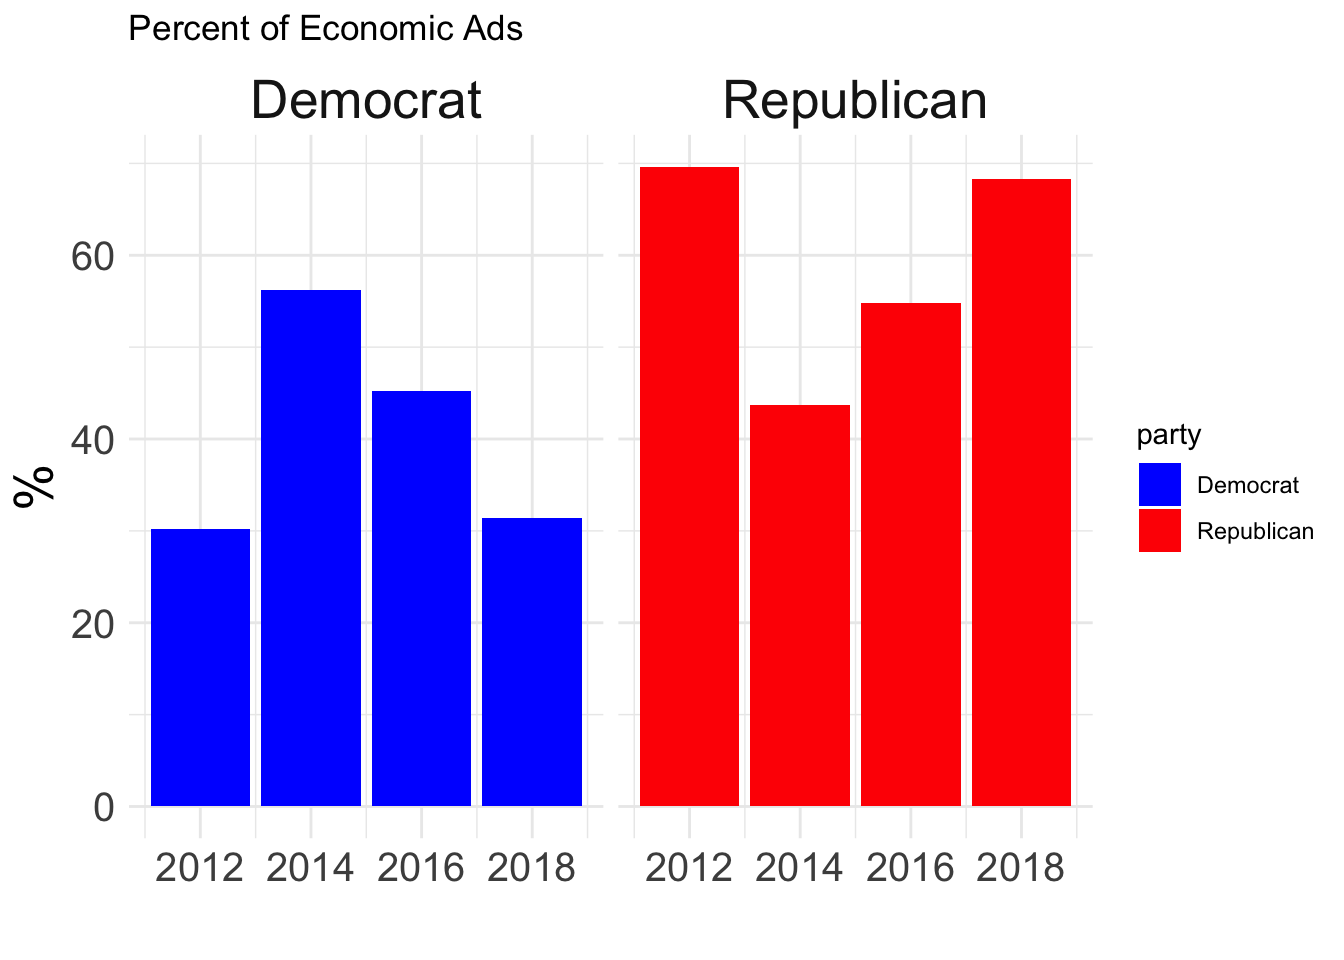
The above graph shows the percent of ads that each party ran that focused on an economic issue. I selected the most popular economic related issues, most of which had to do with taxes, jobs, and unemployment. The Republicans tend to focus on the economy. However in 2014, when the unemployment rate hit 2007 level, having fallen back down after the 2008 financial crisis, the Democrats ads exceeded that of Republicans. The Democrats were the clarifying candidate in 2014, and their ads reflected this. They were also able to gain seats in the house. Democrats are currently the insurgent candidate, and without data I am limited to using 2018 ad data to infer that their primary ad issue will not be the economy.
## [1] 48.35575My prediction including ads is Dems win 48%. However I reject the use of ads in forming my prediction because of its low R2, and the general limited ad information we have district by district. I therefore choose to return to my old prediction of Dems win 51% of the house vote.