on
Blog Post 4
Welcome to my 2022 Midterm blog series. I’m Kaela Ellis, a junior at Harvard College studying Government. This semester I am taking Gov 1347: Election Analytics taught by Professor Ryan Enos, which has led to the creation of this blog. I will use this blog series to predict the 2022 Midterm election. The series will be updated weekly with new predictive measures and analyses of past elections.
This fourth post examines the question of the effect of incumbency of elections. In particular, I look to see how adding in a factor of incumbency would affect the accuracy of my predictions. I believe that incumbency will make predictions more accurate, and should be a factor in my forecast.
There is a widely accepted theory among forecasters called the incumbency advantage. Statistically incumbents have an advantage when it comes to reelection. I will first draw on the novel “Incumbency Advantage in US Presidential Elections: the historical record” by David Mayhew to explain the multiple reasons why elections see this incumbency advantage. Mayhew lists a few different reasons for the incumbency advantage. The first is that incumbents have capabilities while holding office that make them stronger candidates. These capabilities are things such as basic skills, having resources, ability to command attention, make pork barrel concessions, and prerogatives, such as choosing when to sign bills, make speeches, and issue executive orders at advantageous times. Another possible reason for the incumbency advantage is that incumbents are good at campaigning; they have won before and likely have a seasoned campaign manager. Another reason is that voters may be risk-averse, entering in a mentality of ‘the devil you know may be a better bet than the one you don’t know’. There are also perceived start-up costs of a new administration. There may be other factors of voter psychology, as people will revote for the incumbent to convince themselves that they did not make a mistake. Mayhew also discusses Zaller’s prizefighter theory of how incumbents are better competitors than most opponents. These are all reasons as to why during the postwar era only 4 incumbent presidents have lost reelection.
Specific to congressional elections, incumbents who have been in office for a single term tend to lose, while incumbents who have been there for multiple terms tend to get reelected. In determining the incumbency effect on congressional elections, it may be helpful to identify the incumbents by district and determine how many sessions they have held office for.
## Reading layer `districts114' from data source
##   `/private/var/folders/53/y4tjcyz17pq_kfwb17bygwvm0000gp/T/RtmpMX3vq3/districtShapes/districts114.shp'
##   using driver `ESRI Shapefile'
## Simple feature collection with 436 features and 15 fields (with 1 geometry empty)
## Geometry type: MULTIPOLYGON
## Dimension:     XY
## Bounding box:  xmin: -179.1473 ymin: 18.91383 xmax: 179.7785 ymax: 71.35256
## Geodetic CRS:  NAD83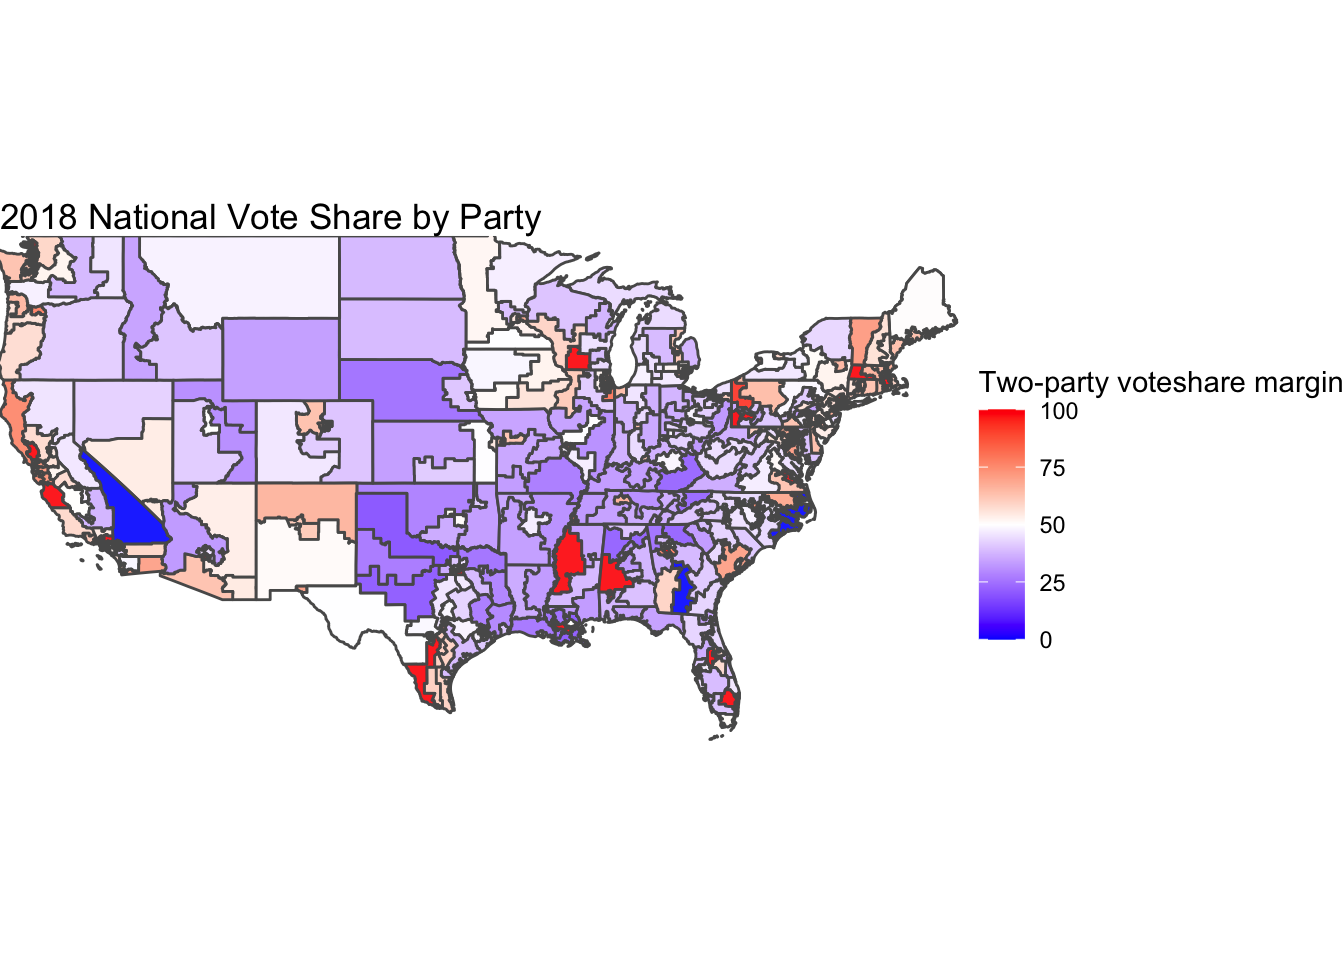
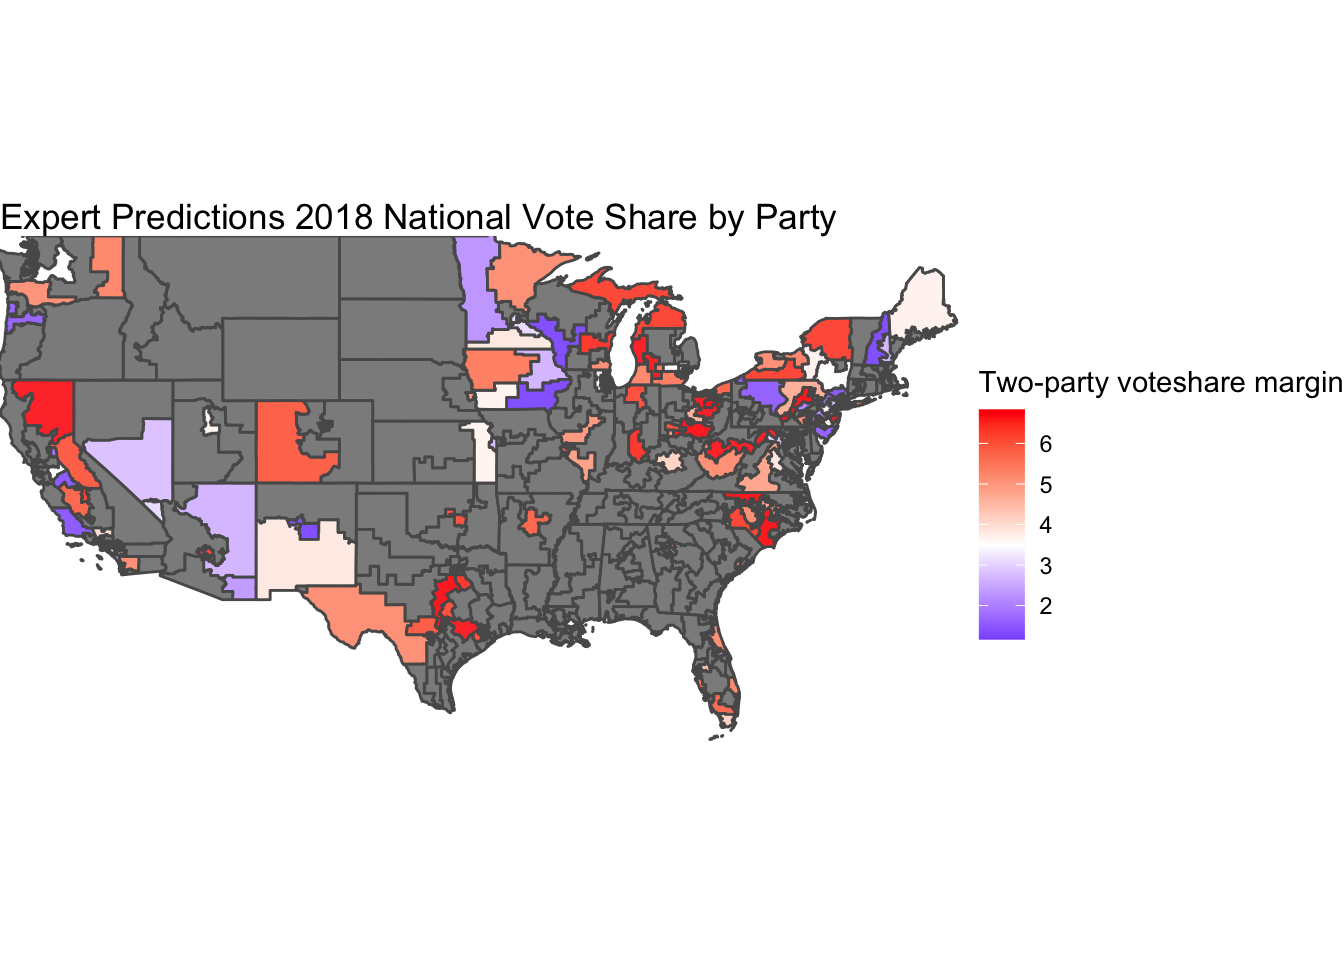 The above graph compares district level expert predictions to the actual national voteshare. Compared to the actual national voteshare, the expert predictions seem to be miscategorizing some states as safe, when in reality they are not. For example, the experts categorized California’s first district as Republican safe, when in reality it was taken by the Democrats. This is also seen in California’s 3rd district, in addition to other districts. Overall, experts seem to experience overconfidence in their predictions. If I choose to incorporate district level expert predictions in my final, I will use other factors to lessen the effect of expert overconfidence.
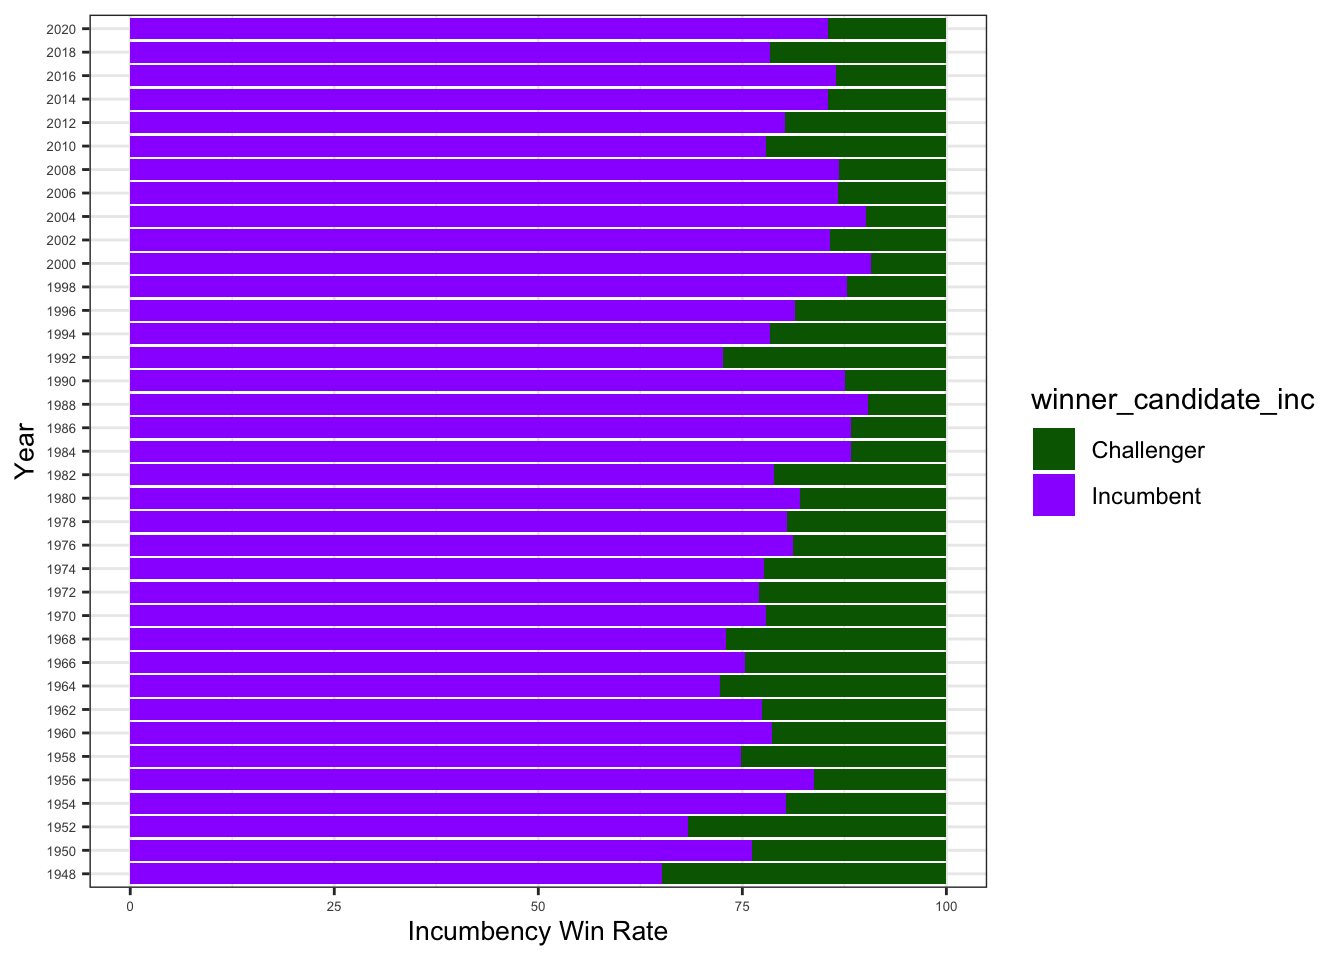 The above graph demonstrates the incumbency effect. From year 1948 to year 2020 the incumbent candidate is reelect roughly 80% of the time. Incumbents have a high chance of reelection. This graph does not account for incumbents who face no challenger, but overall it proves that incumbents have a high reelection rate.
## # A tibble: 16,067 × 21
## ...1 ...2 office year state st_fips district_num distr…¹ winne…² RepVo…³
## <dbl> <dbl> <chr> <dbl> <chr> <chr> <chr> <chr> <chr> <dbl>
## 1 1 1 House 2020 Alabama 01 01 AL01 R 211825
## 2 2 2 House 2020 Alabama 01 02 AL02 R 197996
## 3 3 3 House 2020 Alabama 01 03 AL03 R 217384
## 4 4 4 House 2020 Alabama 01 04 AL04 R 261553
## 5 5 5 House 2020 Alabama 01 05 AL05 R 253094
## 6 6 6 House 2020 Alabama 01 06 AL06 R 274160
## 7 7 7 House 2020 Alabama 01 07 AL07 D 0
## 8 8 8 House 2020 Alaska 02 00 AK00 R 192126
## 9 9 9 House 2020 Arizona 04 01 AZ01 D 176709
## 10 10 10 House 2020 Arizona 04 02 AZ02 D 170975
## # … with 16,057 more rows, 11 more variables: RepCandidate <chr>,
## # RepStatus <chr>, DemVotes <dbl>, DemCandidate <chr>, DemStatus <chr>,
## # RepVotesMajorPercent <dbl>, DemVotesMajorPercent <dbl>,
## # winner_candidate <chr>, winner_candidate_inc <chr>, st_cd_fips <chr>,
## # president_party <chr>, and abbreviated variable names ¹district_id,
## # ²winner_party, ³RepVotes##
## Call:
## lm(formula = DemVotesMajorPercent ~ incumb, data = incumbency)
##
## Coefficients:
## (Intercept) incumb
## 33.77 38.77##
## =================================================
## Dependent variable:
## -----------------------------
## DemVotesMajorPercent
## -------------------------------------------------
## incumb 38.768***
## (0.239)
##
## Constant 33.769***
## (0.177)
##
## -------------------------------------------------
## Observations 16,067
## R2 0.622
## Adjusted R2 0.622
## Residual Std. Error 15.050 (df = 16065)
## F Statistic 26,404.890*** (df = 1; 16065)
## =================================================
## Note: *p<0.1; **p<0.05; ***p<0.01## [1] 55.01673Using the incumbency factor I predict the Democrats will win 55%
## Warning: `funs()` was deprecated in dplyr 0.8.0.
## ℹ Please use a list of either functions or lambdas:
##
## # Simple named list: list(mean = mean, median = median)
##
## # Auto named with `tibble::lst()`: tibble::lst(mean, median)
##
## # Using lambdas list(~ mean(., trim = .2), ~ median(., na.rm = TRUE))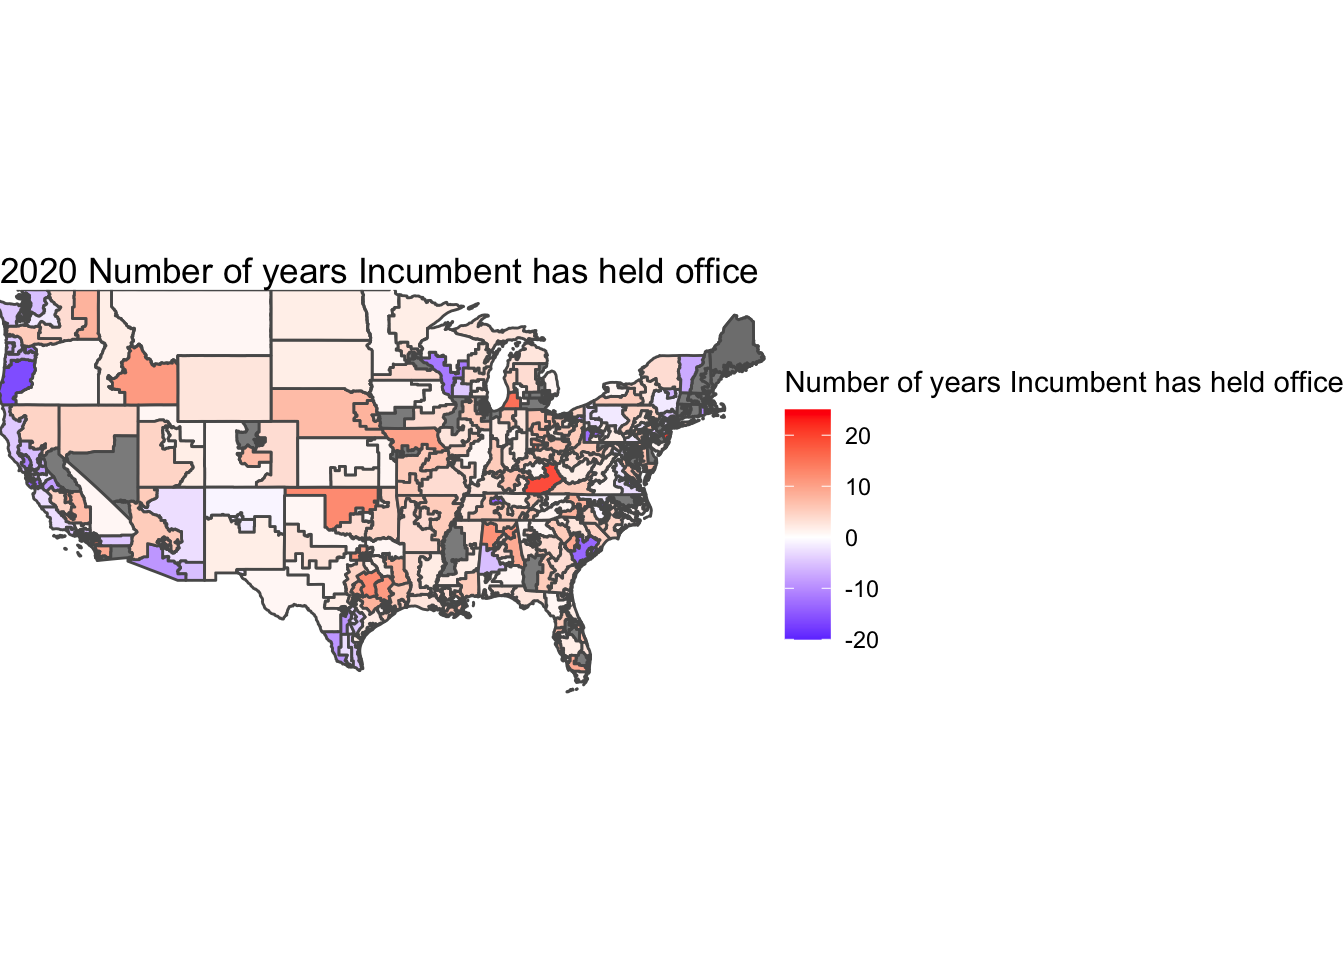 I wanted to look at the number of cycles the incumbent in each district has held office because incumbents who have held office for a long time are more likely to continue holding office. The graph above shows how many years the incumbent in each district has held office. The colors that are vibrant red and vibrant blue indicate that the incumbent has held office for many time. Meanwhile the colors that are more faded- closer to white indicate that the incumbent has held office for less years. According to incumbent voting theories, the white areas are more likely to flip during the election. Therefore, more focus should be placed on these white districts, while the more vibrant districts are likely to reelect their candidate.