on
Blog Post 2
Welcome to my 2022 Midterm blog series. I’m Kaela Ellis, a junior at Harvard College studying Government. This semester I am taking Gov 1347: Election Analytics taught by Professor Ryan Enos, which has led to the creation of this blog. I will use this blog series to predict the 2022 Midterm election. The series will be updated weekly with new predictive measures and analyses of past elections.
##Introduction
This second blog post examines the question of the effect of fundamentals in House elections. In particular, I look to see how the GDP growth affects the predictivity of the popular vote versus the seat share. I predict that the GDP growth will have a more detectable effect on the popular vote than on the seat share. This prediction is informed by the fact that, in a popular vote, voters can directly vote based on whether or not economic conditions are favorable, so the popular vote might be reflective of GDP growth. Meanwhile, the resulting seat share of these votes can be muddled by things like gerrymandering and improper popular vote to seat ratios.
In investigating the effect of GDP growth on popular vote versus seat share, I choose to only look at the 7th quarter- the last complete quarter before people vote. This decision was largely informed from literature by Healy and Lenz. In their article “Substituting the End for the Whole: Why Voters Respond Primarily to the Election-Year Economy” they explain that when voters evaluate actual economic growth they place roughly 80% more weight on Year 4 than on Year 2 of a presidential term. Thus, the most recent economic conditions are better predictive indicators for how people will vote.
I also chose to focus on how the GDP growth is linked to the vote share or seat share of the incumbent party. This decision was informed by “Democracy for Realists” by Achen and Bartels. They outline the retrospective voting theory where voters with limited information can choose candidates based on changes in their welfare. Under the sanctioning model, each voter’s well-being depends on the effort expended by the incumbent leader on their behalf. So, if a voter’s welfare has decreased, voters can hold the incumbent accountable by not reelecting them. Under the assumption that GDP growth is linked to voters’ well-being, GDP growth will affect the vote share, as voters attempt to hold incumbents accountable and prospectively forecast their future well-being under their leadership.
##Effect of Q7 GDP Growth
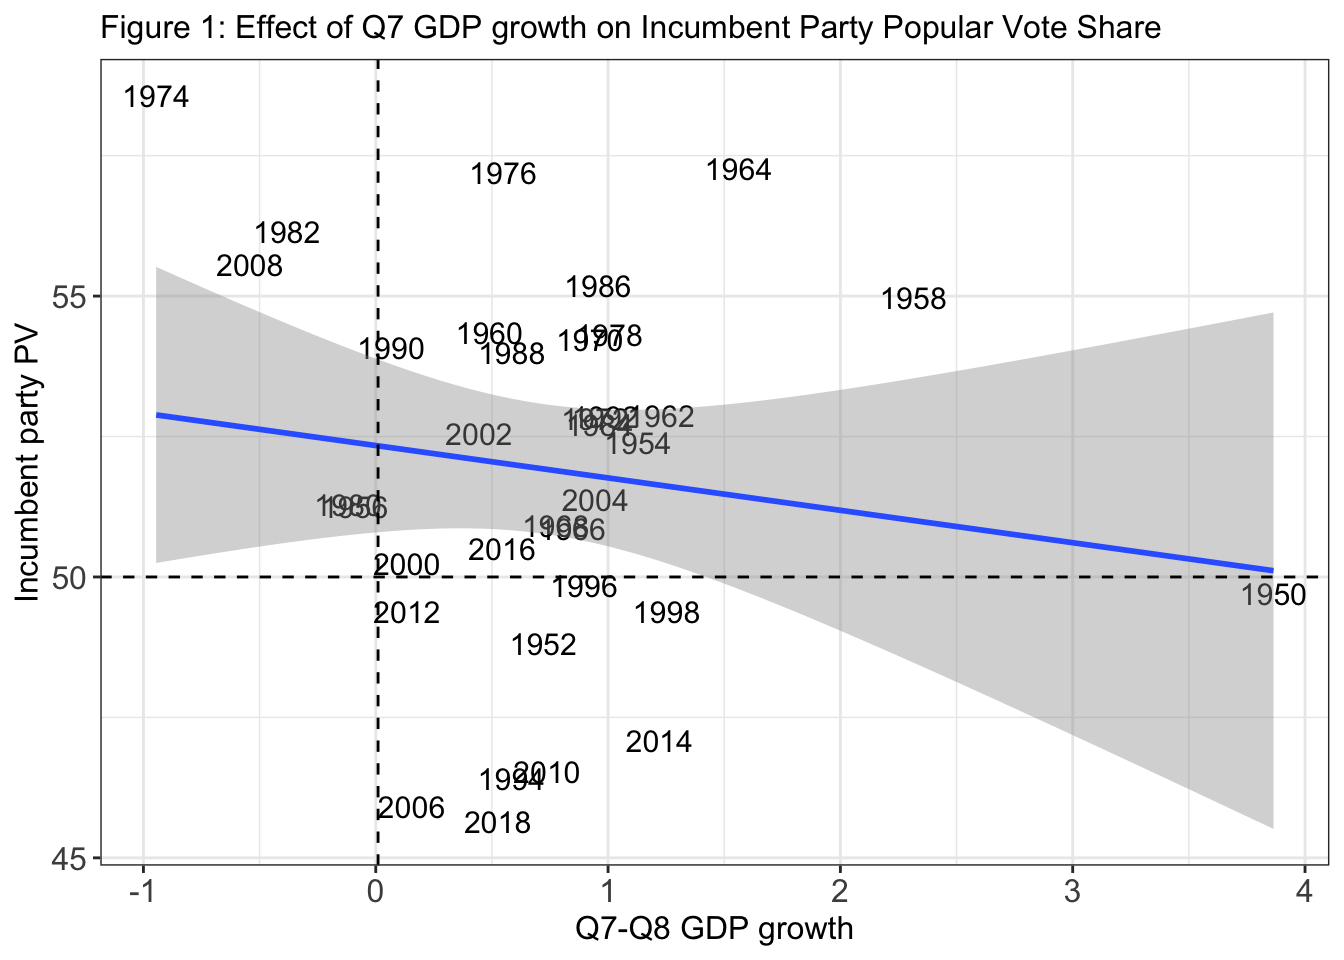
 The first graphic shows the effect of 7th quarter GDP growth on the incumbent party’s popular vote share. Surprisingly, this graph demonstrates that as GDP growth increases, the incumbent party popular vote share decreases. This indirect relationship is counterintuitive because I assumed that as GDP growth increases, the incumbent party popular vote also increases, which is not reflected in the plot. These variables should have a direct relationship. This counterintuitive result is likely due to 7th quarter GDP growth being a poor indicator of economic conditions.
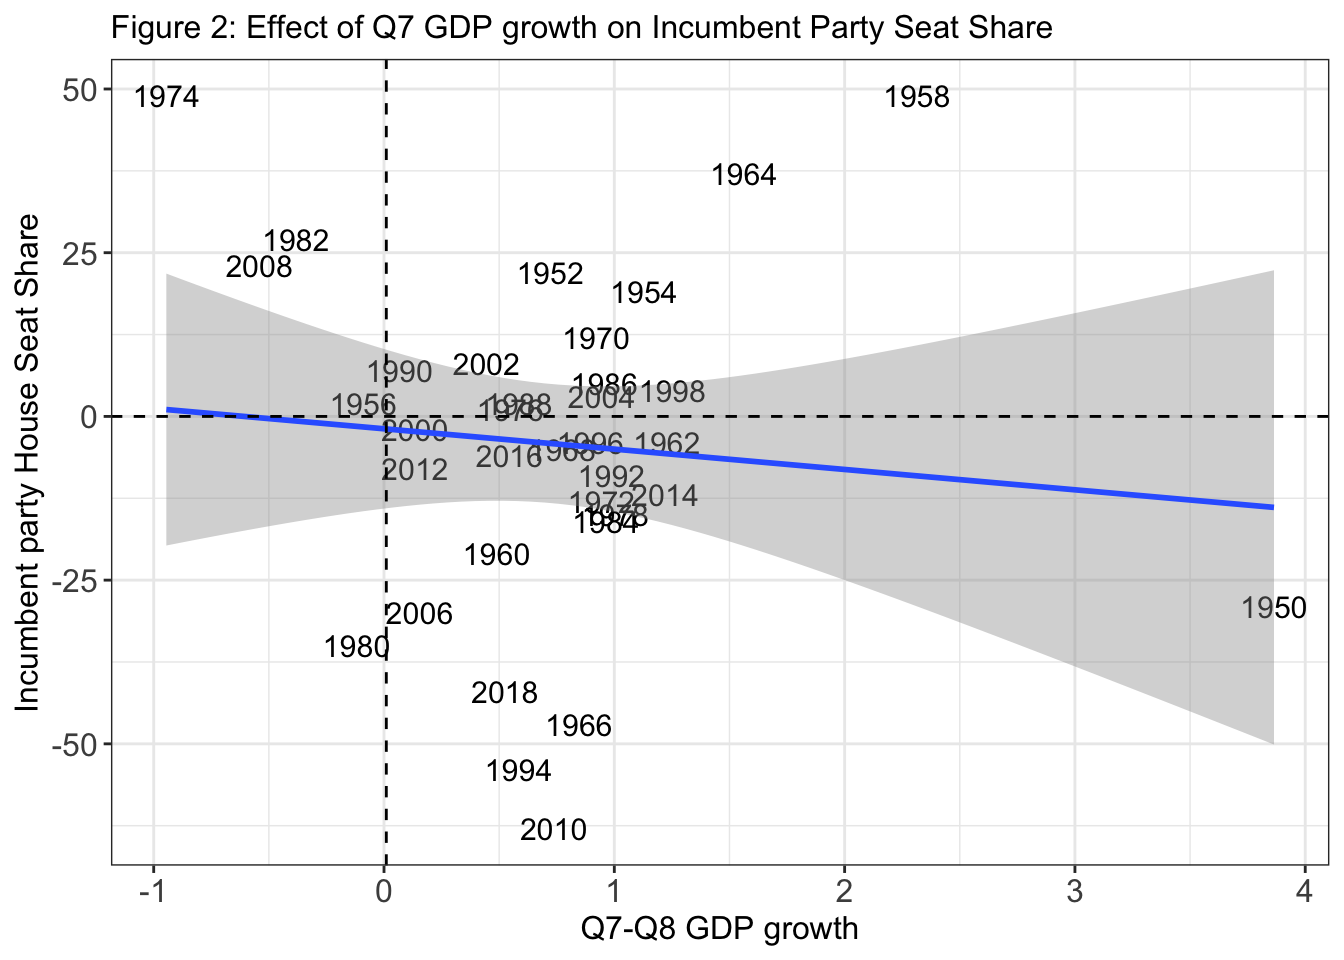
Taking a look at Figure 2, which shows the effect of 7th quarter GDP growth on the incumbent party’s house seat share, we see the same counterintuitive relationship. In future evaluations of the economy, I must keep in mind that 7th quarter GDP growth may not be the best indicator of economic conditions.
The 7th quarter GDP growth has an indirect relationship with both the popular vote and seat share. One difference between these two variables is that, in terms of popular vote, the incumbent party tends to maintain a majority, whereas, in terms of seat share, the incumbent party tends to lose seats to the extent that they lose the majority.
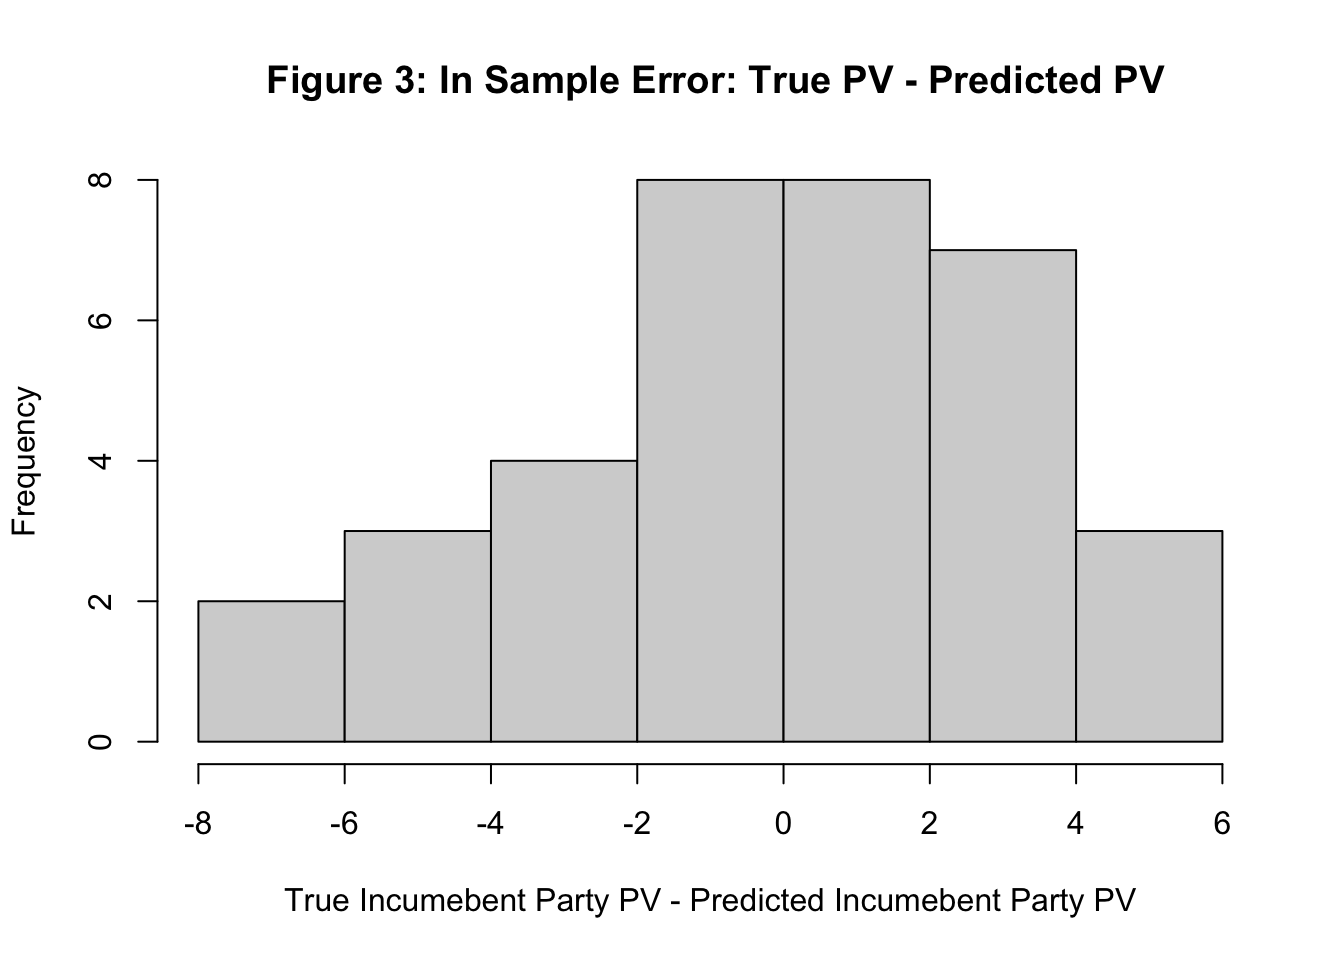
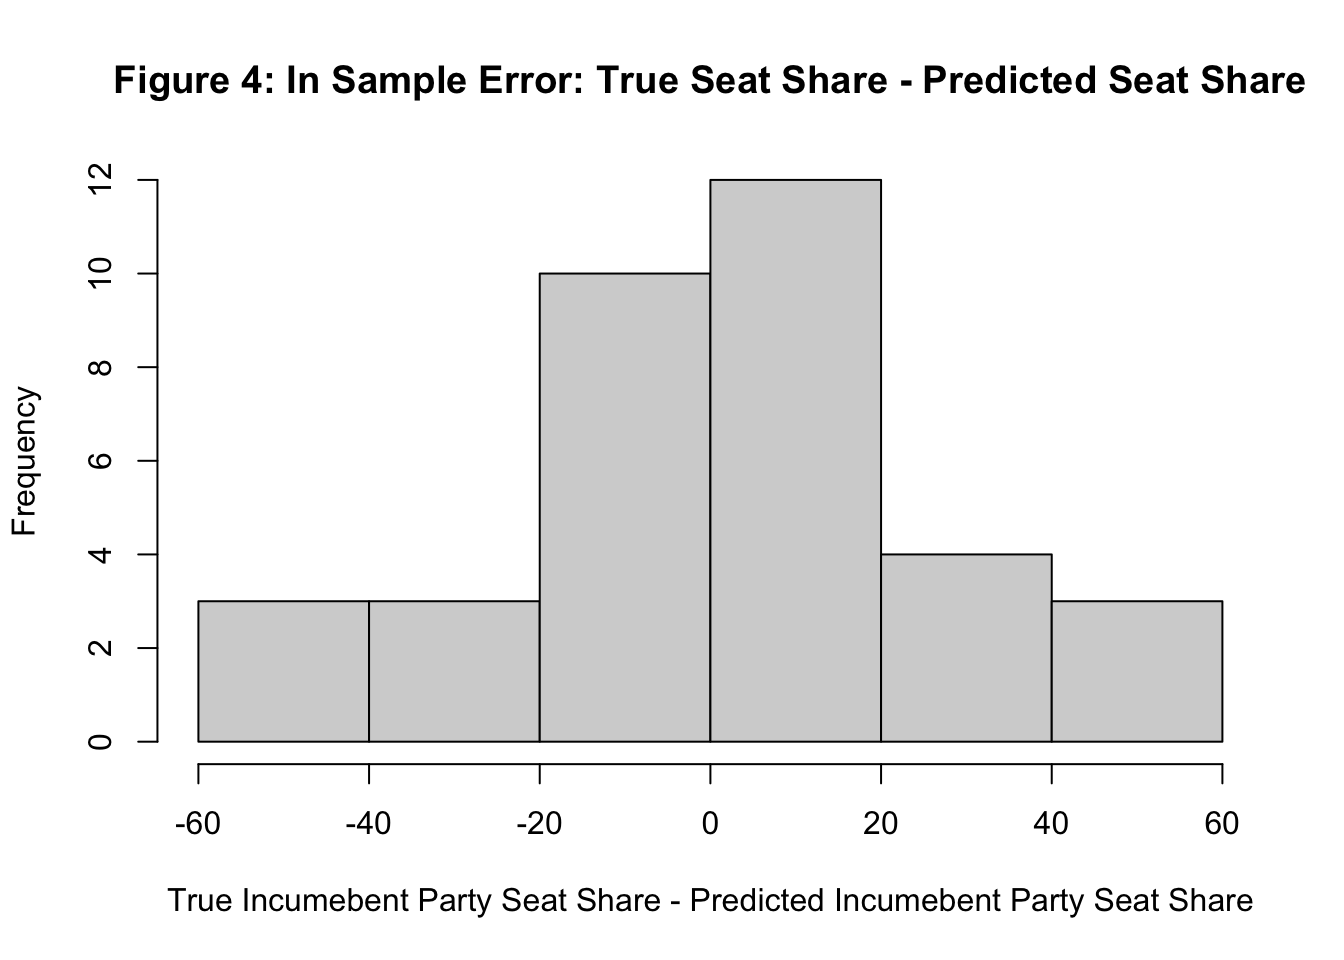 I then conducted a quick test for the predictive value of these models. I plotted the in-sample error via residuals, which is the difference between the observed popular vote or seat share and the predicted popular vote or seat share, as indicated by the blue line in figures 1 and 2.
As Figures 3 and 4 reveal, the popular vote model has a higher predictive value than the seat share model. I was able to determine this because figure 3, which represents the sample error for the popular vote model, residuals are spread across the range of -8 to 6 - numbers relatively close to 0 - while the figure 4, the seat share model has, residuals are spread across the range -60 to 60. The range of residuals for figure 4 are much greater and further away from 0, indicating that the model has limited accuracy. Returning to my prediction, I was right in that the GDP growth has a more detectable effect on the popular vote than on the seat share, since the in sample error for popular vote is less than the in sample error for seat share.
7th quarter GDP growth alone is likely a poor predictor of both popular vote and seat share. This was proven by both the in-sample error plots, and the fact that figures 1 and 2 contradict what should occur when economic conditions improve. In future predictions, I must keep in mind that there are other economic factors that are likely better indicators of the effect of the economy on voting.
##Refrences Christopher H Achen and Larry M Bartels. Democracy for realists: Why elections do not produce responsive government, volume 4. Princeton University Press, 2017. URL.
Andrew Healy and Gabriel S Lenz. Substituting the end for the whole: Why voters respond primarily to the election-year economy. American journal of political science, 58(1):31–47, 2014. ISSN 0092-5853. URL.