on
Blog Post 1
Welcome to my 2022 Midterm blog series. I’m Kaela Ellis, a junior at Harvard College studying Government. This semester I am taking Gov 1347: Election Analytics taught by Professor Ryan Enos, which has led to the creation of this blog. I will use this blog series to predict the 2022 Midterm election. The series will be updated weekly with new predictive measures and analyses of past elections.
##Introduction
This first blog post examines the question of gerrymandering in the 2020 House election. Gerrymandering is a practice in which political boundaries are drawn for voting advantage. In gerrymandered regions the party that has majority vote share may not have the most house seats allocated.
To investigate gerrymandering in the 2020 house election I compare the actual vote share to the number of house seats allocated in each state. This will highlight states where the actual vote share does not reasonably correlate with the number of house seats allocated. I predict that a handful of states will have extreme discrepancies in vote share compared to the house seats allocated, but these will be states that have a low number of house seats. In this, low seat count states like Delaware will have larger discrepancies than high seat count states like California.
##2020 National Vote Share by Party
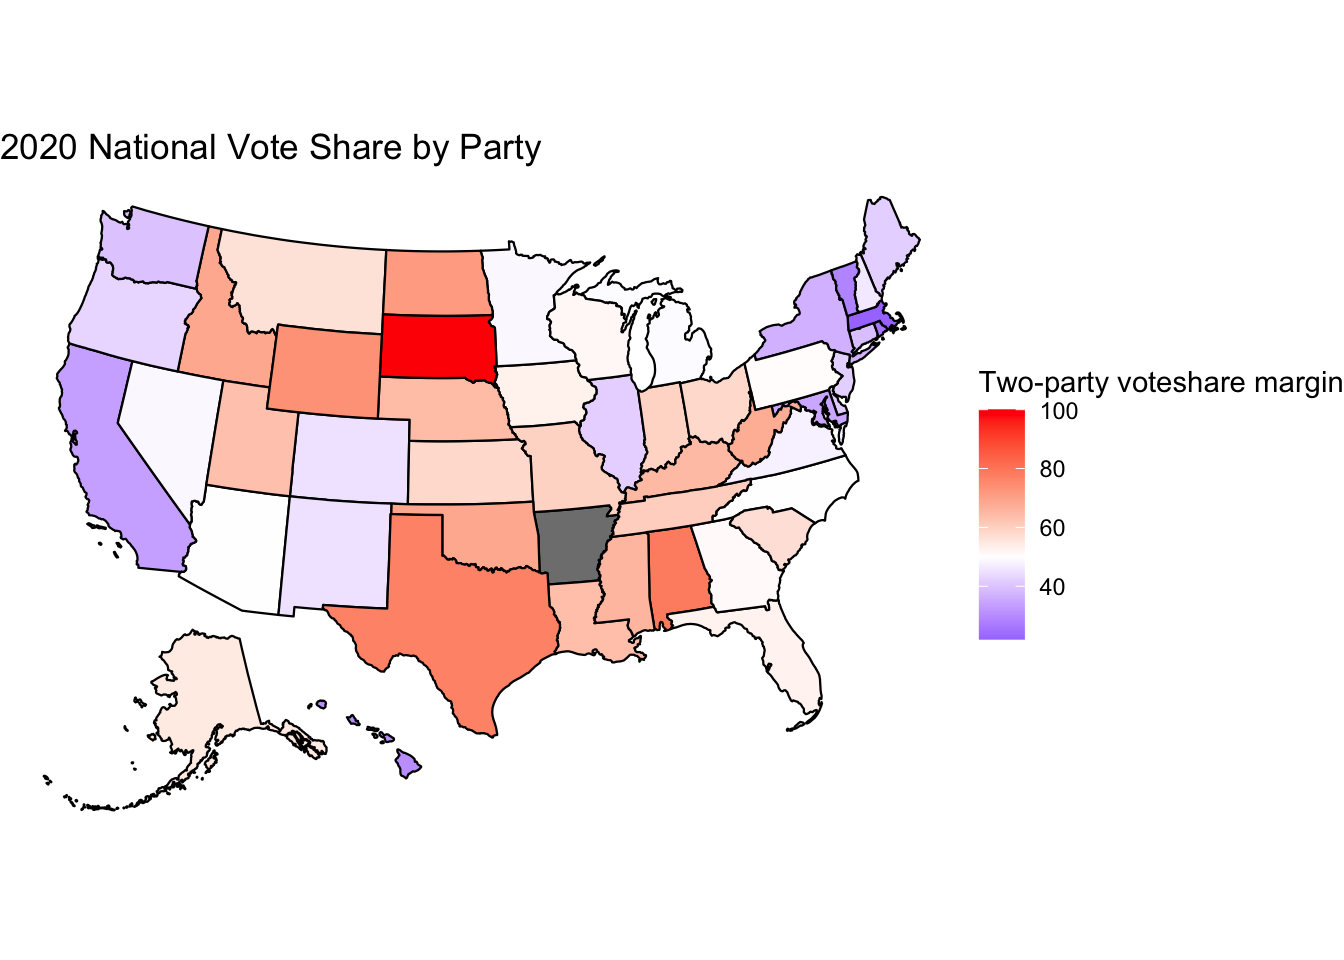
Using the House General Elections, All States, 2020 Summary dataset from the library Congress, I plotted the vote share by party. Looking at the scale, states that are red (with a vote share margin of >50%) have a Republican majority. Meanwhile, states that are blue (with a vote share margin of <50%) have a Democratic majority. The more vibrant the color (the further from 50%) indicates a higher majority of the given party. So, a state like South Dakota has a high Republican vote share, while Massachusetts has a high Democratic vote share, and a state like Pennsylvania has a near equal vote share between the two parties.
A plot of the actual house seats allocated should look similar to this plot, since the actual seats allocated should be reflective of the vote share. If a plot of the actual seats allocated is not similar to this plot, it may be indicative of gerrymandering.
##2020 National Seat Share by Party
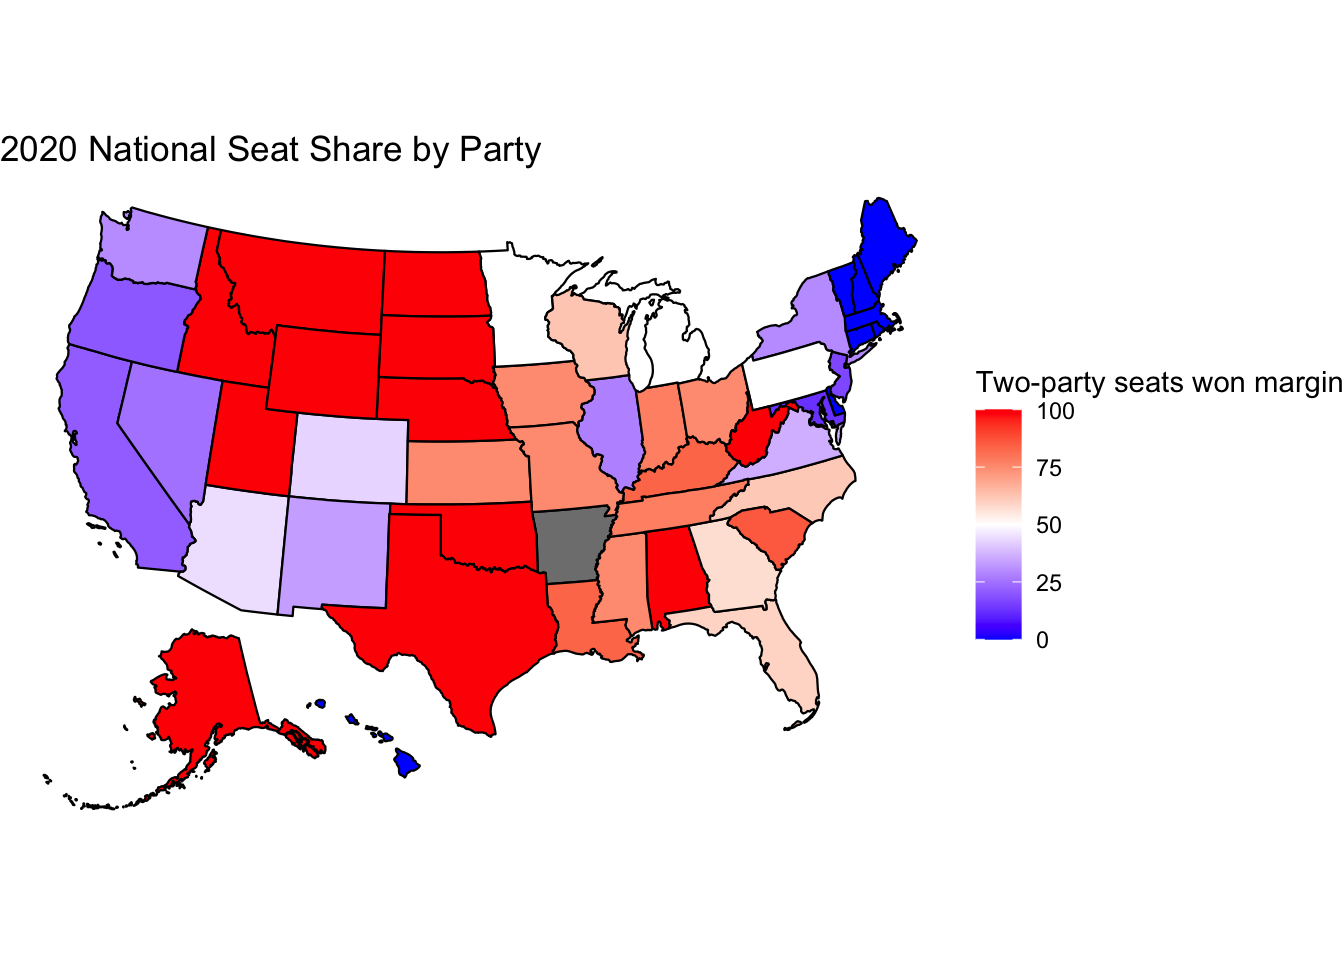
The above plot shows the actual house seats allocated after the 2020 election. This map is not similar to the vote share map. There are more states with extreme blue or red toned colors, meaning that these states have more seats of one party than its vote share would indicate. The house allocation plot makes the U.S look more polarized than it is in reality. There are no states that flipped, meaning that a state that had a majority Democratic vote share flipped to a Republican house seat majority or vice versa. However, many states appear to be gaining more seats in their majority vote share party than they should be.
##2020 National Vote Share vs House Seats
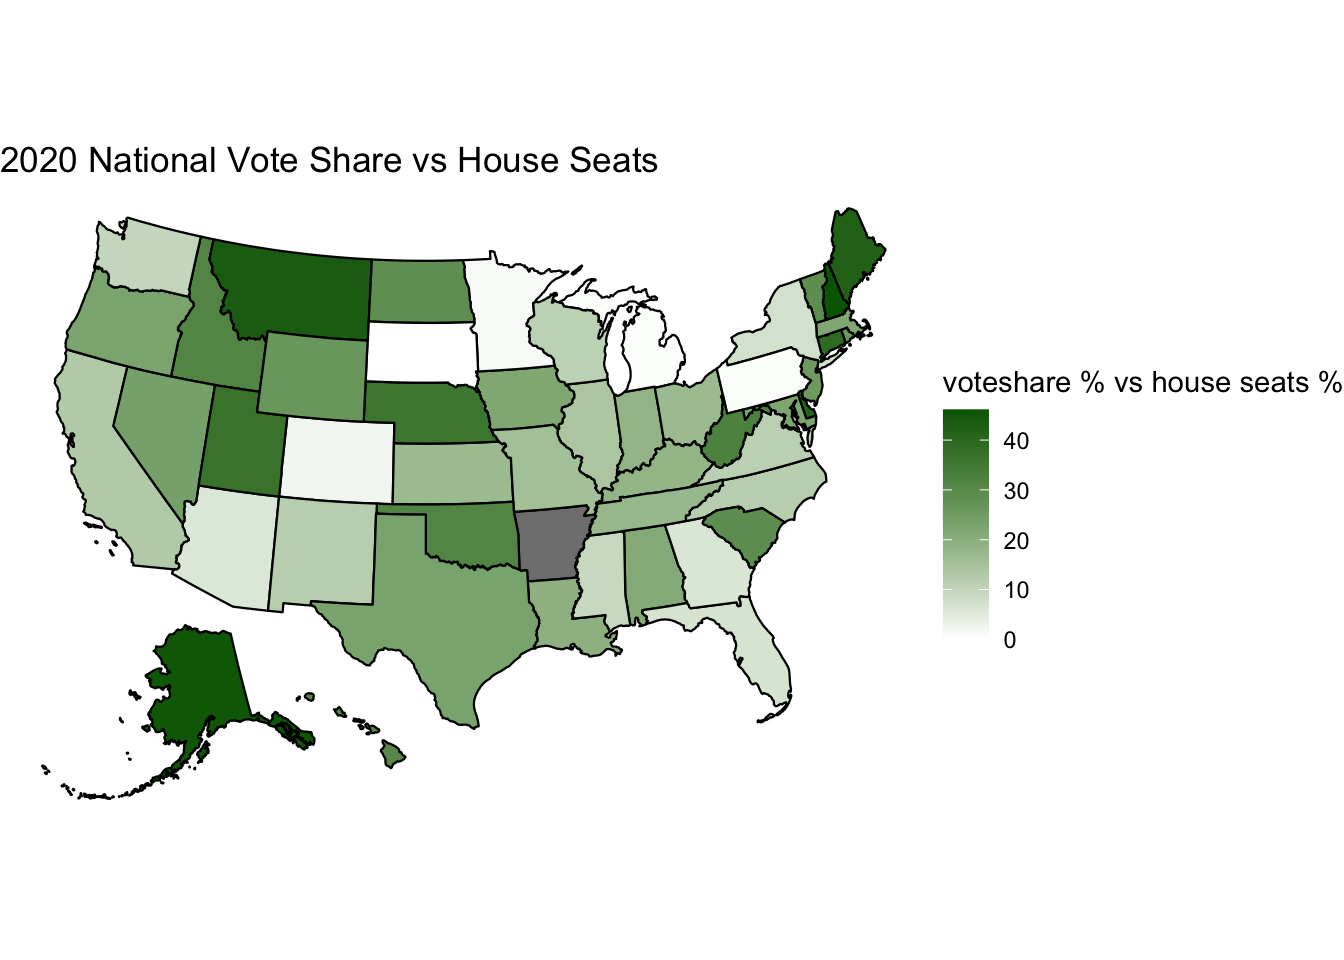 This plot highlights the states with the largest discrepancies between their national vote share and their house seats allocated. The states in the darkest green have the largest discrepancies, as in some states the vote share differed from the actual house seats allocated by as much as 46%.
The states with the highest discrepancies are Alaska, Delaware, Maine, and New Hampshire. However, as I predicted, the states with the largest discrepancies are the states with the lowest number of house seats; they all have 2 house seats or less. It makes sense that large discrepancies occur when a state only has one seat to allocate, but has a 50/50 vote share. For example, taking a look at Delaware, the Republican party won 41% of the vote, but it only had one seat to allocate. They gave this seat to the majority, Democratic candidate, creating a 41% point discrepancy. This does not indicate gerrymandering.
However, states like Maine and New Hampshire are gerrymandering suspects. In Maine, the Republican party won 42% of the vote, but both seats were given to the Democratic candidates. Similarly, in New Hampshire, the Republican party won 46% of the vote, but both seats were given to the Democratic candidates.
Other states that are also gerrymandering suspects based on this framework are Connecticut, Iowa, Maryland, Nebraska, Nevada, New Jersey, Oregon, South Carolina. To determine if these states are actual gerrymandering suspects more research needs to be done. However, these plots have allowed me to identify suspects. In making my predictions for the 2022 midterm, I will keep these in mind.